Elevation Chart
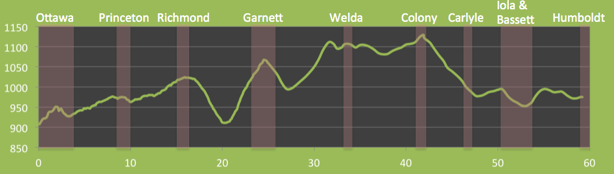
As you look at the chart remember the differences between the vertical and the horizontal scale. The overall differences in elevation are about 200 feet over the distance of 50 miles. While this looks hilly, at most times the grades are imperceptible.
Elevation charts between cities
For a printable version of all charts, click here.
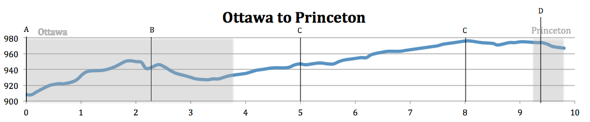
In the above chart A is the Ottawa Depot, B is the Ottawa Trailhead, both Cs are resting benches by the trail and D is the Princeton Trailhead.
The trail within Ottawa is a bit varied in elevation, but this is mitigated by the fact that it is paved. Climbs are easier and the coasting downhill is quit enjoyable when the opportunity arises. There are, however, many stops for cross traffic. Once outside the city limits (a little past the overpass for I-35) the trail is basically a steady climb all the way to the 8 mile mark, one mile before you hit Princeton. The climb is only about 16 feet per mile, so it is practically imperceptible. There is tree cover for most of the way, but since the trail runs North-South a lot of sun will get through in the middle portions of the day. There are slight bumps while the trail rises to meet the crossing county roads, you might want to raise out of the seat while crossing as the surface is much rougher than on the trail.
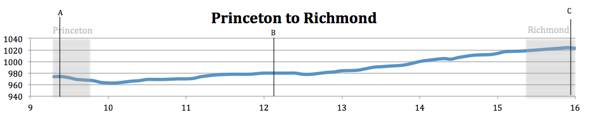
In the above chart A is the Princeton Trailhead, B is a resting bench by the trail and C is the Richmond Trailhead.
This section of the trail is wooded as you approach the towns but the center is pretty wide open. The grade is slight, a rise or drop (depending if you are headed North or South) of about a foot every tenth of a mile. On windy days this section can seem much harder than it is, due to the lack of cover. The bench at about the 12 mile mark has a nice view of a round house to the South.
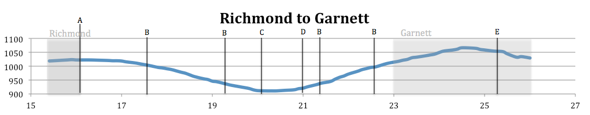
In the above chart A is the Richmond Trailhead, the Bs are resting benches by the trail, C is another resting bench and a bridge, D is the Pottawatomie Creek Bridge and E is the Santa Fe Depot and Garnett Trailhead.
The most difficult section of the trail from either direction. From the 20 mile mark there is a 5 mile climb in either direction, 125 feet to the North and 160 feet to the South. There is a reason why this section is well supplied with benches. The recently replaced Pottawatomie Bridge is a good place for a rest or a picnic. This section is well travelled out of Garnett, so expect to see other cyclists, runners or walkers.
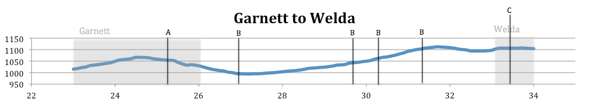
In the above chart A is the Santa Fe Depot & Garnett Trailhead, the Bs are resting benches by the trail and C is the Welda Trailhead.
The first couple of miles out of Garnett are a steady down slope as one leaves the Santa Fe Depot. Soon after passing over Highway 59 the ascent to Welda begins. Over 10 miles the trail steadily gains 100 feet in elevation. It is a grade that seems to make a difference while heading South, but while travelling North does not seem to be a great aid to the cyclist. During this stretch the terrain transitions from wooded to “High Plains.” The surroundings give way to scrub brush and some natural prairie. Look for long vistas and little shelter from the wind. The climb flattens out one mile to the North of Welda giving an easy ride into town.
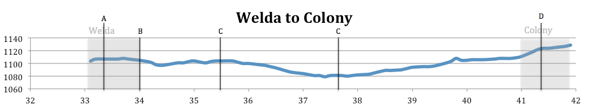
In the above chart A is the Welda Trailhead, B is the tunnel under Highway 169, the Cs are resting benches beside the trail and D is the Colony Trailhead.
Excepting the mile outside of Colony, the cyclist would be hard pressed to perceive this section of trail as anything but flat. While there is some grade, it is much less than on other sections of the trail. There are occasional trees beside the trail as it heads almost straight South between Highway 169 and Old Colony/Welda Road, some of which bear fruit in season. Mostly, however, there is a chance to catch some long range prairie vistas. Bring your water, this stretch will tend to make you thirsty.
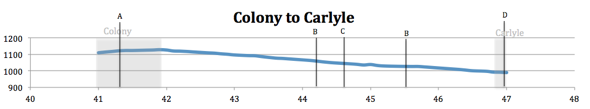
In the above chart A is the Colony Trailhead, Bs are resting benches beside the trail, C is the tunnel under Highway 169 and D is the Carlyle Trailhead.
From the edge of Colony to the Carlyle Trailhead is about 5 miles. The difference in elevation between those two spots is over 100 feet. If you are heading North, you will be climbing. South, descending. While the grade is one or the other, the terrain is very schizophrenic, dividing at almost the halfway point as the trail goes under Highway 169. The Northern half is a continuation of the “High Plains” vistas typical of the Welda/Colony leg of the trail. The Southern half quickly becomes wooded, quite densely in fact. It is easy to miss the ruins of the Lumberman’s Cement Company off to the East obscured by the trees and foliage.
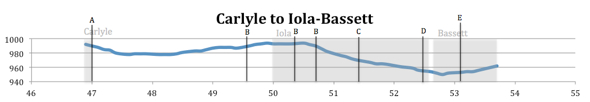
In the above chart A is the Carlyle Trailhead, Bs are resting benches beside the trail, C is Iola Trailhead at Chofachique Park, D is Riverside Park and E is the bridge over Elm Creek.
Between Carlyle and Iola the Prairie Sprit Trail is extremely flat. Technically, the low point between these two cities is a bridge over a tributary of the Neosho River at Mile 48. Inside Iola, the elevation drops as the trail approches the Neosho River proper. After crossing a bridge over the river the trail gains elevation as it enters Bassett. Currently the trail ends at Chofachique Park, but the section to Riverside Park should soon be open.
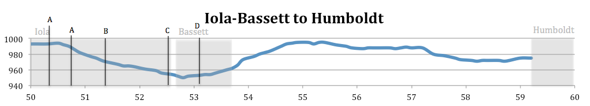
In the above chart the As are resting benches beside the trail, B is the Iola Trailhead at Chofachique Park, C is Riverside Park and D is the bridge over Elm Creek.
The Southwind Rail Trail opened in 2013.